2021 New Home Sales, Inventory, and Housing Starts: Where We Are and What's to Come
September 15, 2021
In June, we took a closer look at how the housing market fared during the first half of the year. The industry was still breaking records for new home sales, but builders were still juggling challenges on several fronts.
A Look at the Numbers
Let’s review the most recent industry numbers from Zonda’s Chief Economist, Ali Wolf.
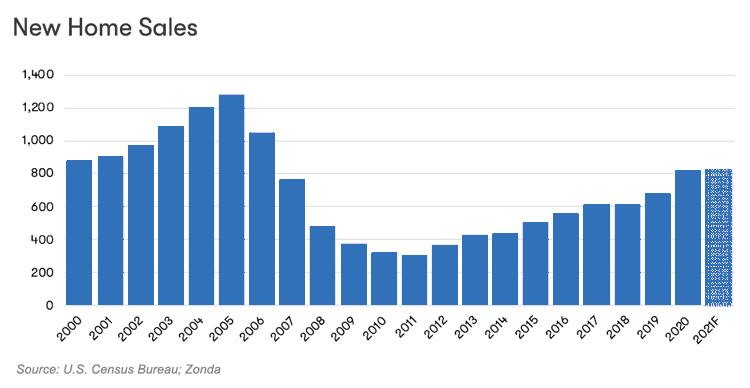
First, new homes sales were up 2.4% year over year. While this number may not be as exciting as it was a year ago, total new home orders are back to 2019 levels. And when you look at the average sales rate, you can see the industry is still performing well above pre-pandemic levels:
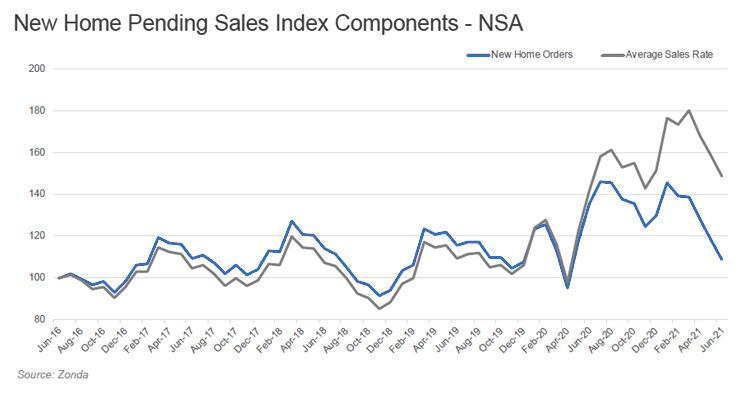
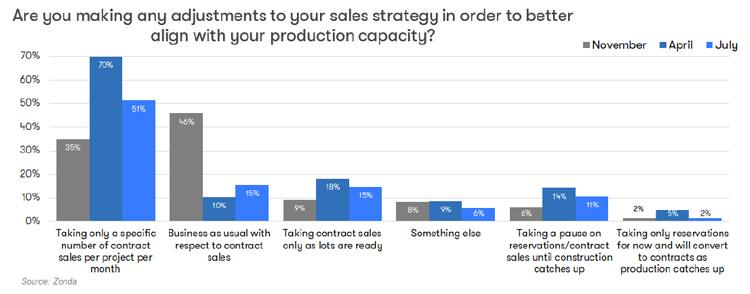
This is partly due to builders intentionally slowing sales and keeping community counts low. In fact, 85 percent of builders have said they’re purposely slowing sales to better align with production capacity.
That means, however, that 15 percent of builders have been taking contracts per usual. We believe July is an inflection point, and that going forward we’ll see fewer builders capping sales.
As a result, we should expect to see negative year over year numbers in new home sales throughout the rest of the year due to inventory, sales caps and, in part, slowing demand, which has just come back down to earth a little bit.
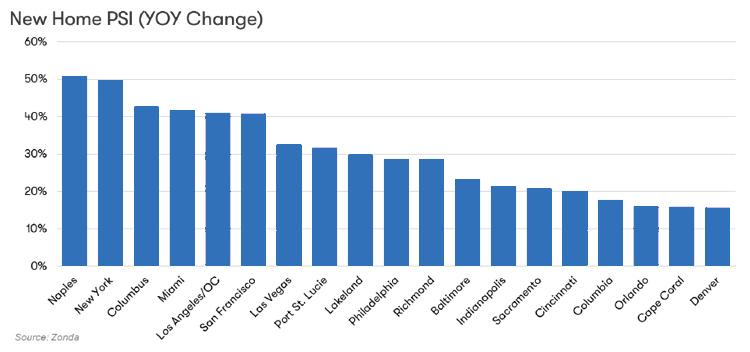
However, as you can see below, growth is still happening across the country:
Let’s also take a look at how the market has fundamentally changed over the past two years:
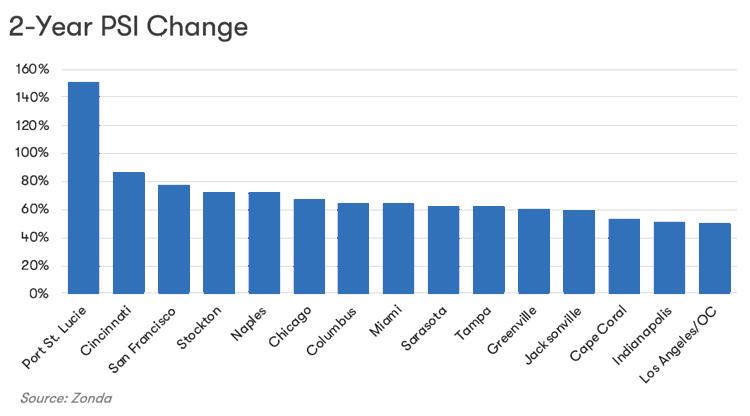
Many of the markets above have seen the majority of activity . As a result, getting your hands on supply in these markets has become even more competitive.
What about the average sales rate compared to 2019? Again, we see clear outperformance against 2019 for most markets:
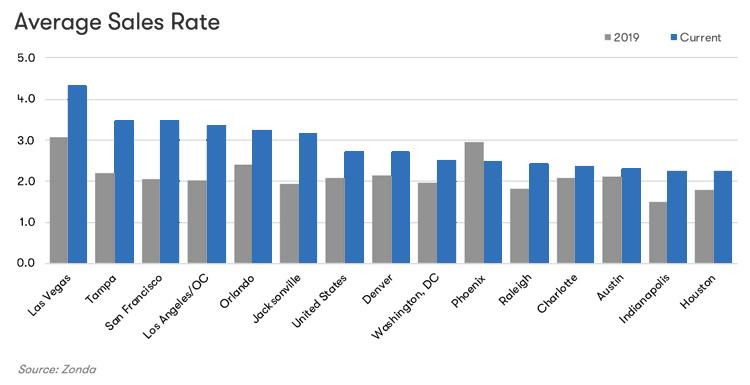
Even with many builders putting sales caps in place, the industry is still outperforming levels from two years ago. Keep a close eye on Phoenix, though. That market, which may be a little too hot for its own good right now, is running into some production capacity, seeing a little bit of a price ceiling and enjoying too much demand to match overall inventory levels on ground. What’s happening in Phoenix should help us understand what to expect in other markets.
Inventory and New Housing Starts
For now, we’ve yet to see the bottom for the new home market — or new community counts:
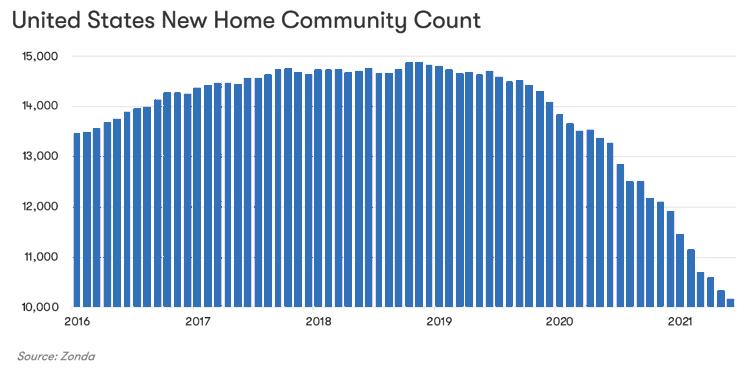
That’s because we’re seeing builders sell out of communities quicker than they can replace them. Vacant developed lots are at all-time lows, while lots under development have increased 14 percent year over year. However, we expect more lots to turn into vacant developed lots later this year and into the first half of next year, with the expectation that we will start to see community counts begin to go back up over the next three to four months.
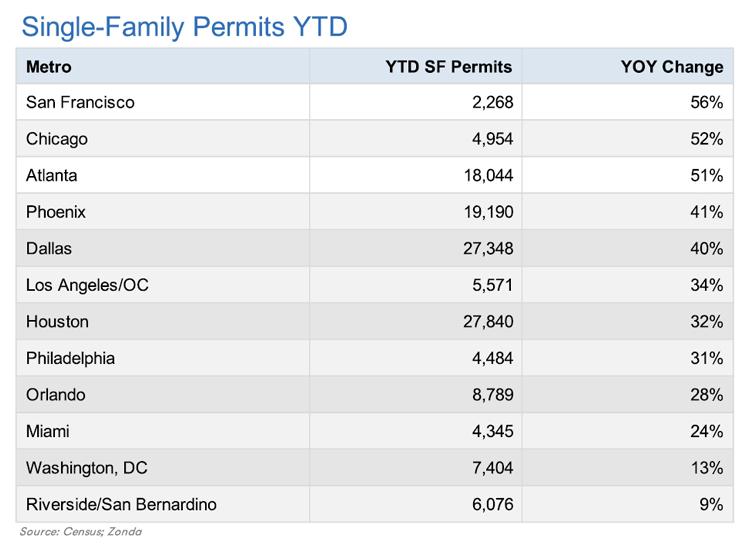
Single-family permits are still up year over year across the country, in markets both big and small, ranging from 56 percent in San Francisco to 9 percent in Riverside/San Bernardino:
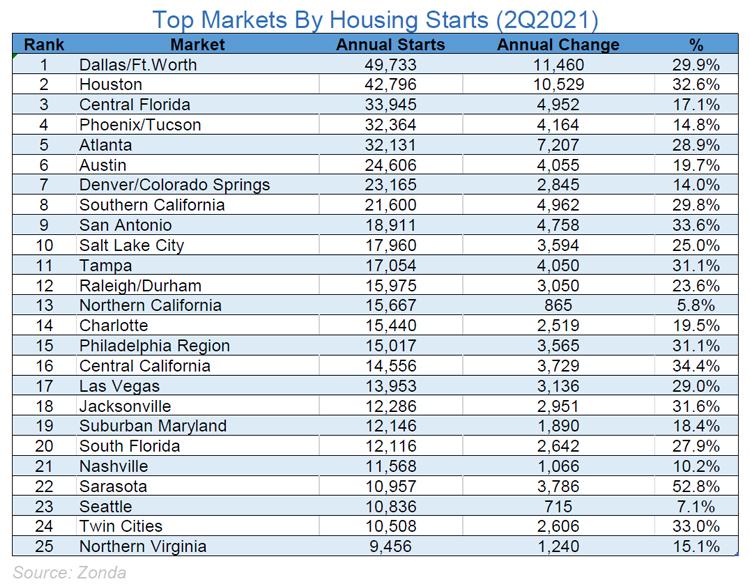
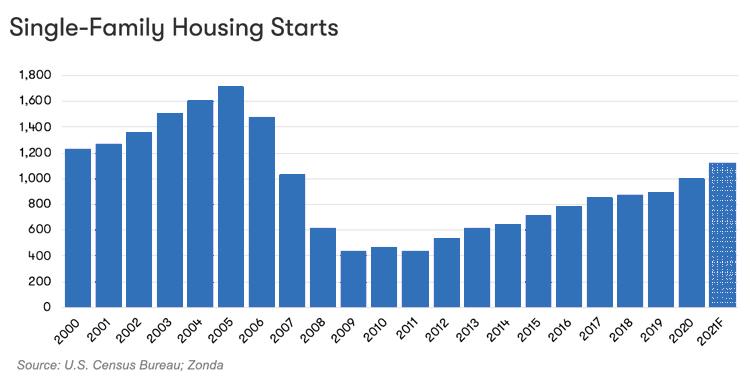
Not surprisingly, housing starts are highest in Texas, Florida, Arizona, and Georgia, which have some of the largest markets in the country, with enough land to build on and relatively easy regulatory challenges to navigate:
Forecasts and Final Thoughts
Despite some delays in starts, sales caps, and increased supply chain challenges, Zonda still forecasts solid starts growth this year of 13.4 percent:
The forecast for new home sales, which continues to be held back by factors other than demand, is a more cautious 1.2 percent year over year (down from an optimistic 9.8 percent back in May). This goes back to low community counts and 85 percent of builders capping sales. Demand has softened a bit, but a combination of several factors make it difficult for builders to keep up with demand. Builders are still doing better than last year — and any year since 2007:
All of the factors we’re seeing on the labor, supply chain, and land fronts come back to no one having a crystal ball to know how to plan for 35 percent growth.
Despite these challenges and some shifting mindsets, why is housing still solid in 2021? It all comes back to the basics of the housing market:
- Lifestyle changes (e.g., getting married, having kids)
- Home equity
- Stock market
- Low interest rates
- FOMO
- Increased savings
- Rising prices
All of these motivating factors continue to be a very strong lure for home buyers. If any of these begin to shift or falter, then it may be time to reassess the overall strength of the housing market, but for now the industry remains strong.
- For more insights on the trends shaping homebuilding and the homebuying market, read the transcript of August’s Market Intelligence webinar.
- Sign up below to be notified of our next Market Intelligence Webinar.