HOW HOUSING SALES BREAK DOWN BY PRICE BRACKET IN DIFFERENT MARKETS
November 22, 2022
It's always important to plan strategically, but especially so when there are more challenges in the market. We often see national market numbers in the news, but it's probably more helpful to get a breakdown of housing numbers by market and price bracket. When we see these numbers, it's clear that certain markets and certain price brackets are still going fairly strong.
Zonda Chief Economist Ali Wolf recently shared information on housing sales rates by price bracket in many of the country's major markets as well as incentives offered by builders, and how those are tied to successful sales rates. These national housing trends may be useful for builders outlining their near-term strategies.
THE NATIONAL PICTURE
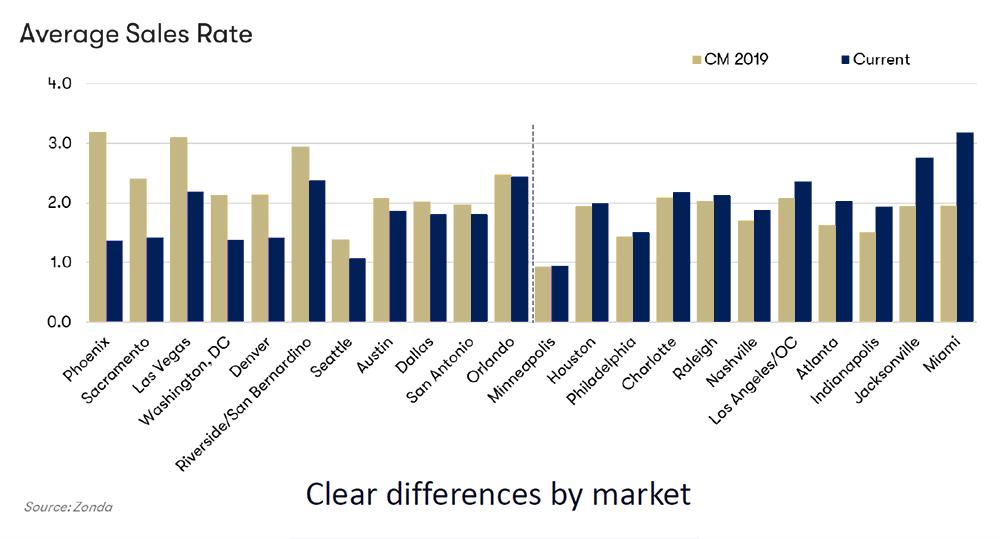
Around half of our major markets are actually showing higher sales rates than in 2019 - our last normal year pre-COVID. Jacksonville and Miami are leading the way with sales rates up by about a full point over 2019.
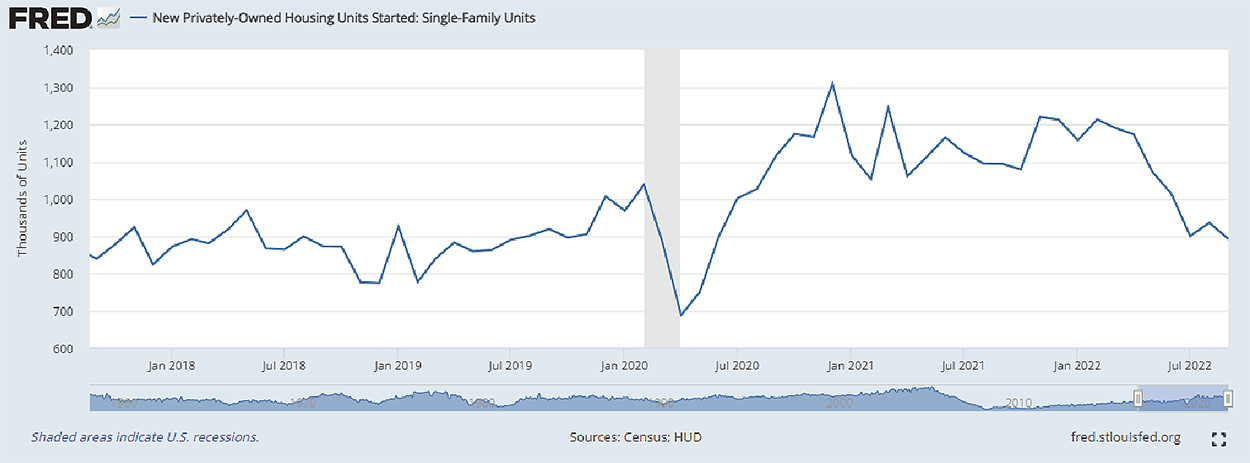
It’s true that, nationally, single-family starts have slowed over the past couple of years, but Wolf emphasized the importance of putting data into historical context. When we do that, we see that starts are in fact about the same as they were in 2019. And that's what we are seeing:
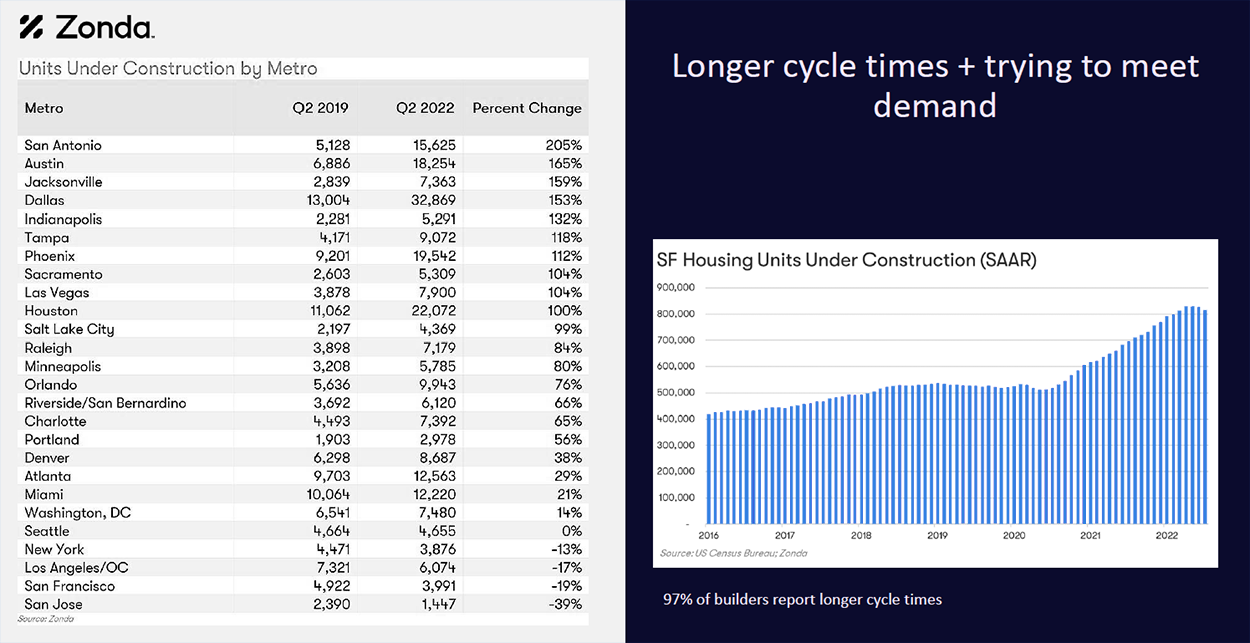
Units under construction are at a near-record high, but Wolf cautions that this is at least partly explained by longer construction times.
If the sales rate in each market is broken down according to house price, we can see distinct differences in the three price brackets: lower, middle, and upper.
As we delve into the differences in the three price brackets, note that the sales rate of the lower third tends to be higher than in the middle, which in turn is higher than in the upper. For the lower third, the sales rates are between just over 5% to around 1%. In the middle, they’re between just over 3.5% to around 1%. In the upper, they’re between about 2.75% to about 0.5%.
(Also note that the bar chart for the lower third price bracket has whole percentage points on the vertical axis. The charts for the middle and upper third have half-percentage points on the vertical axis.)
LOWER THIRD PRICE BRACKET
In the lowest price bracket, buyers rely more on their income than on their wealth. This includes first-time home buyers who don’t have equity to put into a new home, so these buyers are naturally more sensitive to mortgage interest rates.
Nevertheless, 23% of the top markets in this price bracket have a sales rate slightly higher than in 2019. Philadelphia is a noted outlier as its sales rate for houses priced in the lower third bracket is about a percentage point higher now than it was in 2019.
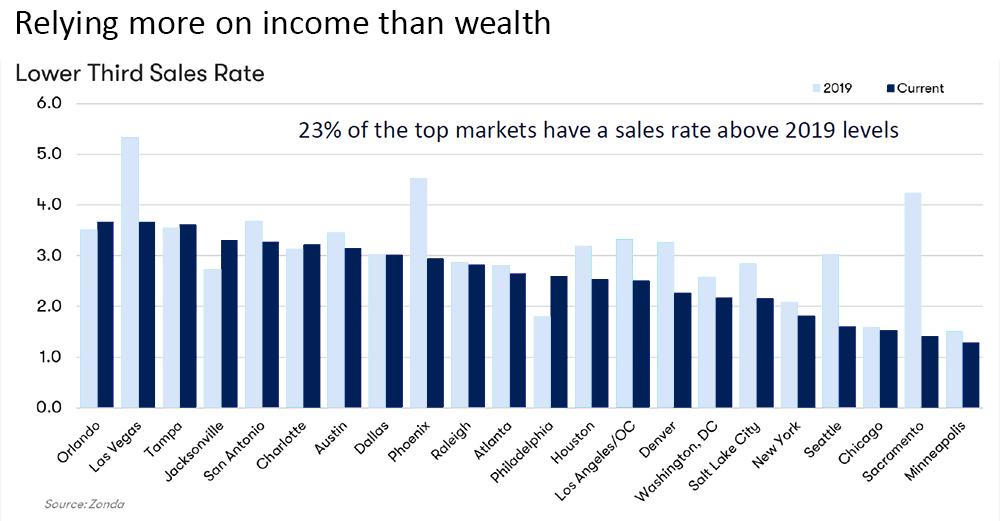
In some of the markets with lower sales rates than 2019, such as Las Vegas, Phoenix, Sacramento, and Seattle, Wolf notes that “those were some of the markets that had the most massive run-ups.” There have been smaller drops in Denver, Los Angeles/OC, Houston, Salt Lake City, and Washington, DC.
MIDDLE THIRD PRICE BRACKET
In the middle price bracket, buyers are a bit less dependent on income and may have some wealth to tap into. These buyers are less sensitive to mortgage rates than in the lower third. (But more sensitive than those in the luxury market.)
In this price bracket, half of the top markets have a sales rate that’s above 2019 levels. The sales rate in Jacksonville and Tampa is significantly higher than in 2019. In the other markets that currently have a higher sales rate than in 2019, the differences are smaller.
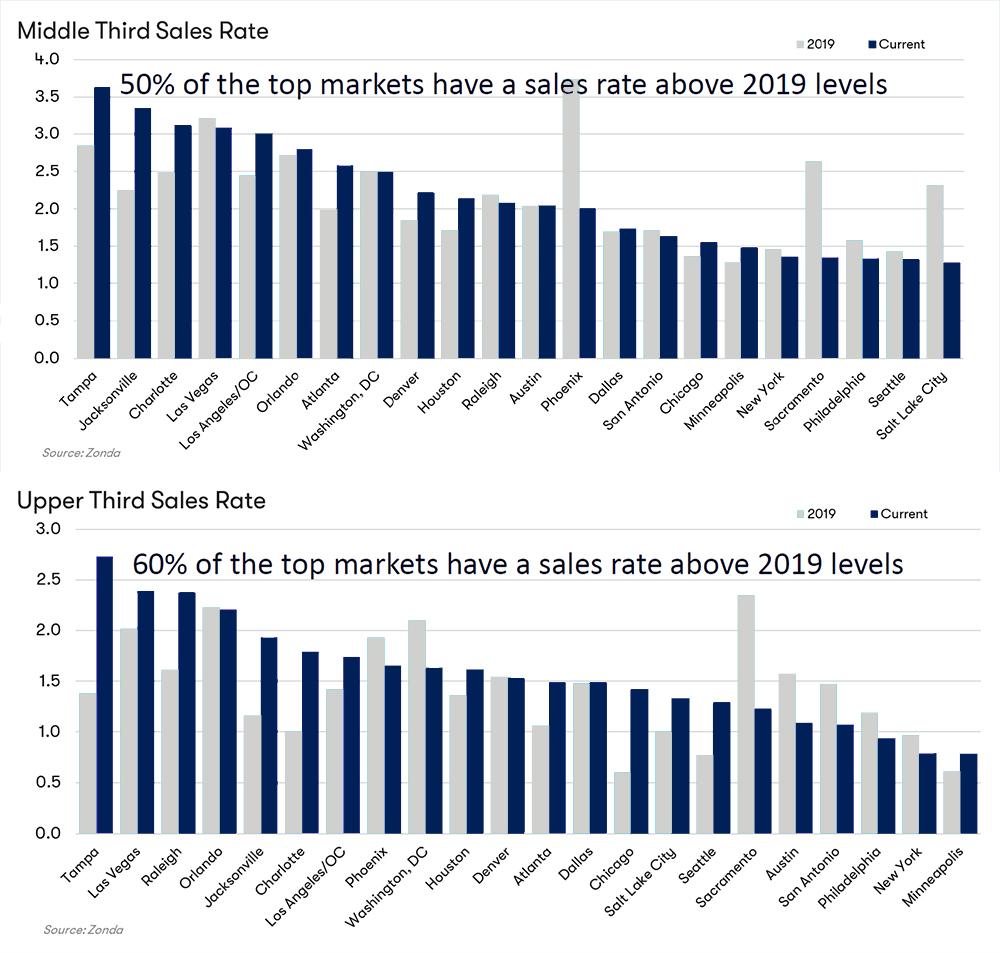
UPPER THIRD PRICE BRACKET
Even though “there have been stock market fluctuations and not everyone is willing to tap their stock holdings, there’s still some outperformance compared to 2019,” Wolf says.
In fact, in the upper price bracket, 60% of the top markets have a higher sales rate than in 2019. The sales rate in Tampa is up about 1.5 percentage points compared to 2019.
In this price bracket, markets that have a lower sales rate since 2019 have generally experienced only a small change. The outlier is Sacramento, which has experienced a drop of about a percentage point. However, recall once more Wolf’s point that Sacramento was among the markets that had a rapid and large price increase before 2019, so it’s unsurprising that it would now be among the markets with the biggest drops in sales rate.
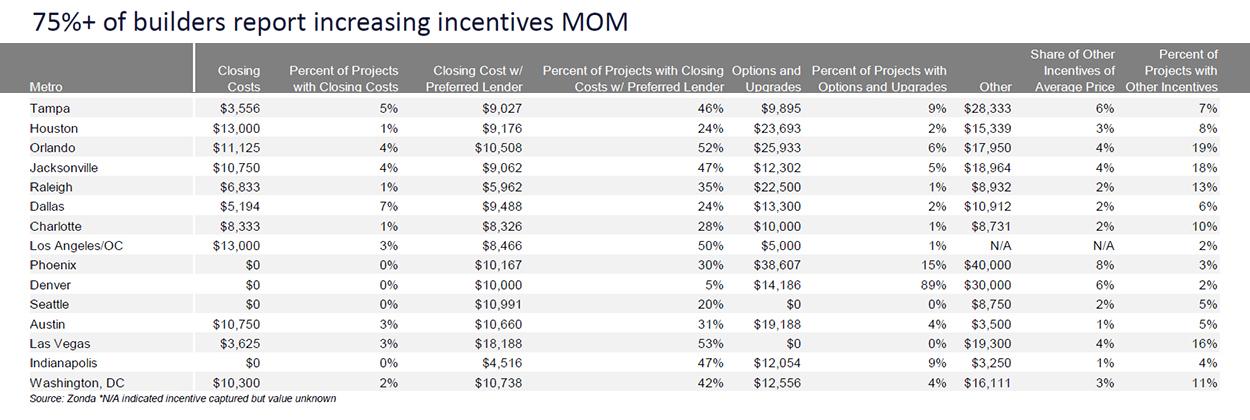
BUILDERS’ INCENTIVES
Buyers are currently very sensitive to the headlines, and in September, 93% of builders reported hesitancy from buyers. However, Wolf reminded us that record numbers of buyers are still interested in buying a home. There’s untapped demand that hasn’t gone away. In this context, she mentioned the ‘lock-in effect’: Homeowners can be reluctant to sell their current home and get a new mortgage at a higher interest rate. But many can be enticed.
This is why many builders are responding by increasing the incentives they offer. In September, 75% of builders reported increasing the incentives they offer compared to the previous month. However, Wolf noted that incentives are not as widespread or as high cost as in 2019. At the low end of the spectrum, in New York, only 23% of projects had incentives. In that market, the sales rate is the same as in 2019.
When offering incentives, it’s important for builders to be sensitive to their regional market, and also to their customers’ motivations — which differ depending on price bracket. Although some buyers are hesitant, they still want to buy homes — and many in all three price brackets are being persuaded to do so.