IS THE HOUSING MARKET BACK ON THE UPSWING?
May 8, 2023
In the April Market Intelligence Webinar, Zonda Chief Economist Ali Wolf discussed the latest economic numbers related to the housing market, and why there is optimism among her team for the future of the industry, particularly in certain regions of the country.
THE NATIONAL ECONOMY
Jobs and Unemployment
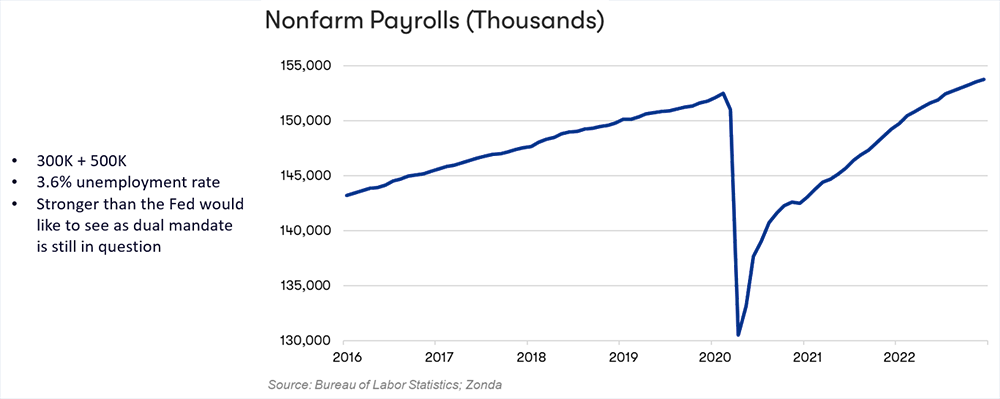
Recent jobs reports have been promising. The country has 2% more jobs than it did going into the pandemic. “We've had two stellar jobs reports to start the year, with 500,000 jobs added in January, and 300,000 added in February,” Wolf says.
The national unemployment rate went from 3.4% to 3.6%. This is partly because of layoffs, but Wolf suggests it’s also partly because more people have re-entered the workforce, which “is a good reason for the unemployment rate to go up.”
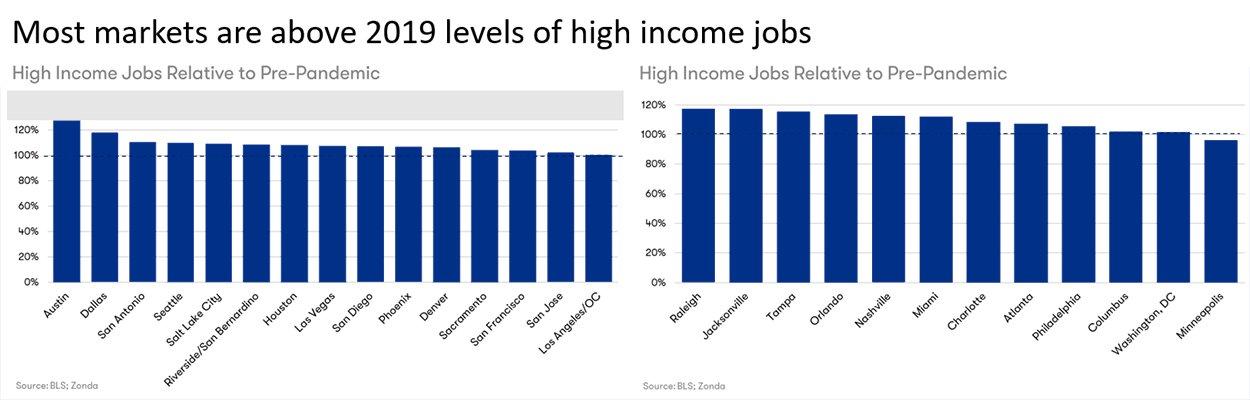
The labor market is generally strong across the country with healthy unemployment rates. (The national average is 3.5%.) And almost all markets are at or above 2019 levels of high income jobs.
INFLATION
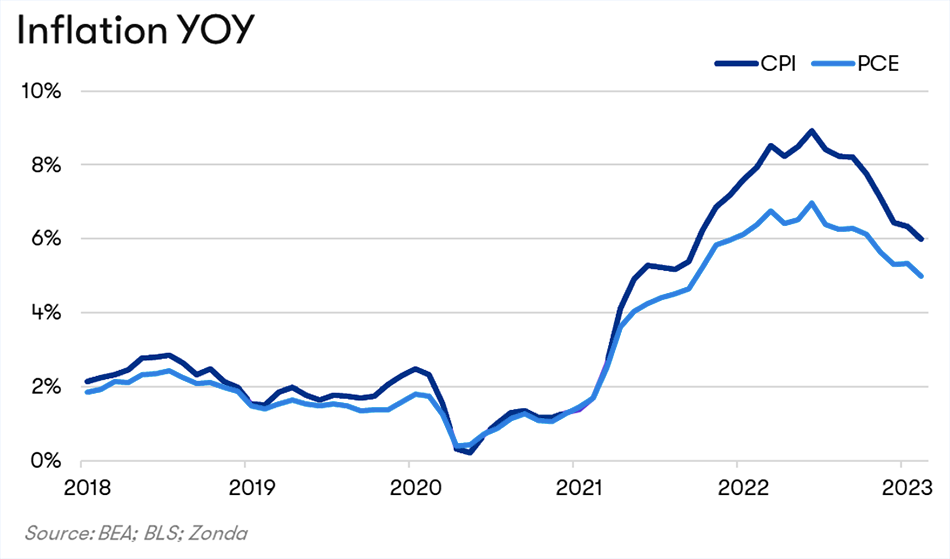
The Personal Consumption Expenditure index is at +0.3% MOM and +5.0% YOY. The Consumer Price Index is at +0.4% MOM and +6.0% YOY.
The indexes for food, recreation, household furnishings and operations all contributed to these increases. The food index increased 0.4% MOM, for example. However, the index for shelter was the largest monthly contributor, accounting for over 70% of the increase.
The Federal Reserve has been raising interest rates to try to get inflation under control, and Wolf says it does look like the country is now past the peak of inflation.
“Super core” inflation has energy and housing subtracted out. This is because energy is volatile and housing has a very delayed effect on inflation. This index puts inflation at about 4% — which is an improvement from where we were, but not quite to the 2% rate that the Federal Reserve deems healthy. This is why interest rate increases are still ongoing.
THE NATIONAL HOUSING MARKET
Spring selling season has started much stronger than expected, partly due to pent-up demand. Some buyers have been put off by higher mortgage rates, but they could delay buying for only so long. They’ve now accepted the current economic reality and recognized that they’re going to have to manage with higher interest rates.
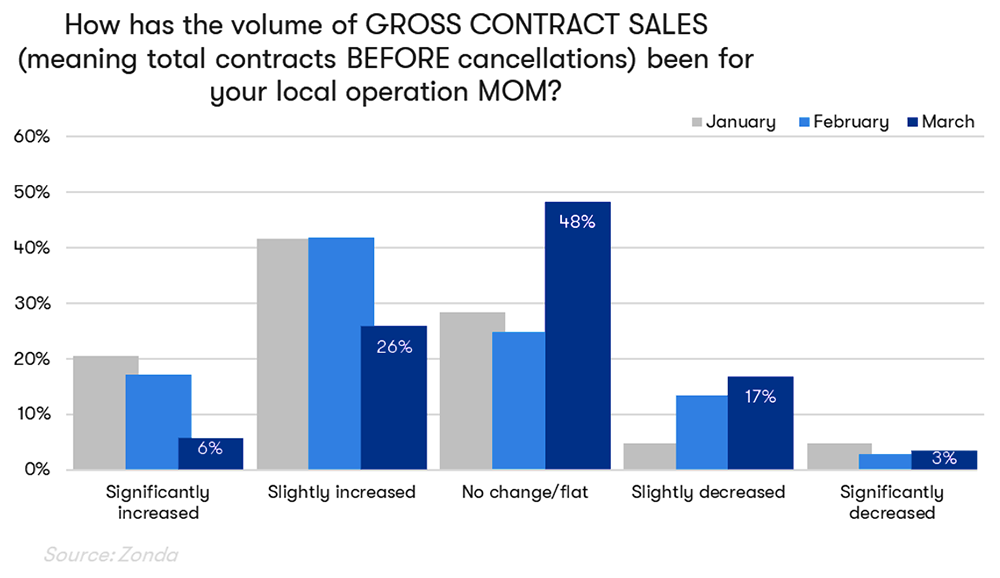
In March, the biggest share of builders (48%) say that there's been no change in the volume of their gross contract sales MOM. 32% say it's increased.
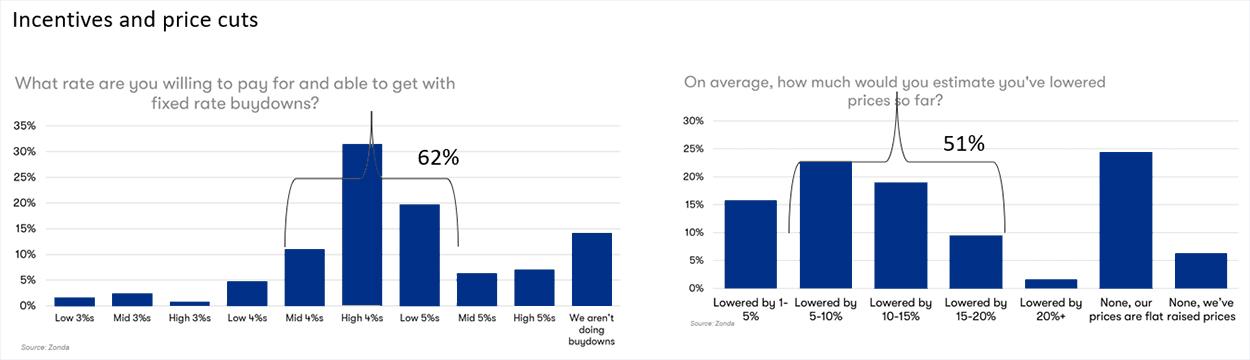
DISCOUNTS
Zonda’s data shows that the number one reason renters are still renting is what Wolf called FOBATT — fear of buying at the top. Builders have tapped into this pool of potential buyers and figured out what makes these people come in from the sidelines. 62% of builders have offered mortgage buydowns and about half of builders (51%) say they've lowered their prices, on average, between 5% and 20% since last year.
At a 6.26% interest rate (the average in February 2023), a 20% price cut gets monthly payments back to spring 2022 levels. At a 7% interest rate, to get back to spring 2022 payment levels, price cuts of between 25% and 30% are needed.
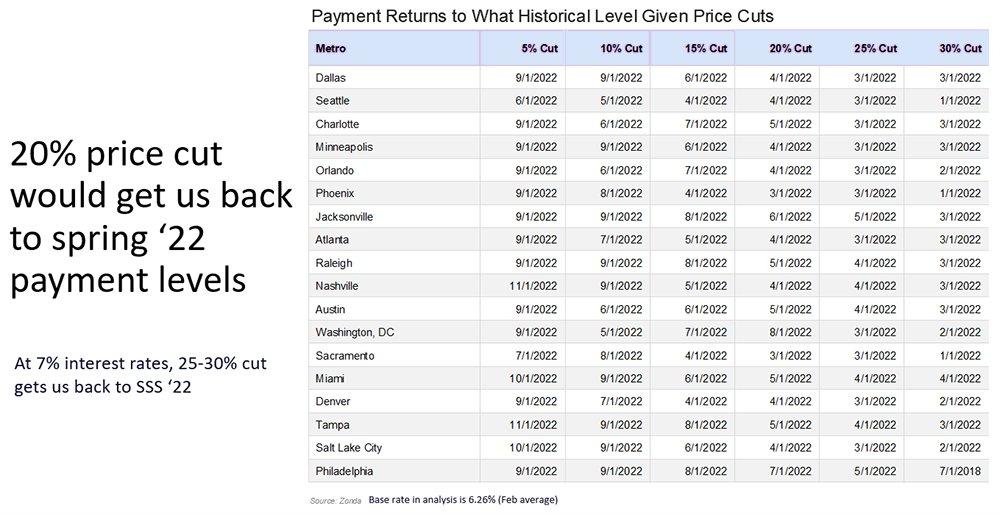
However, Zonda crunched the numbers and figured out that a 5% to 10% price cut with a 5% buydown has the same effect of getting payments back to spring 2022 levels as the more drastic 25-30% price cuts.
REGIONAL VARIATIONS
How does all this play out in the housing market, at a regional level?
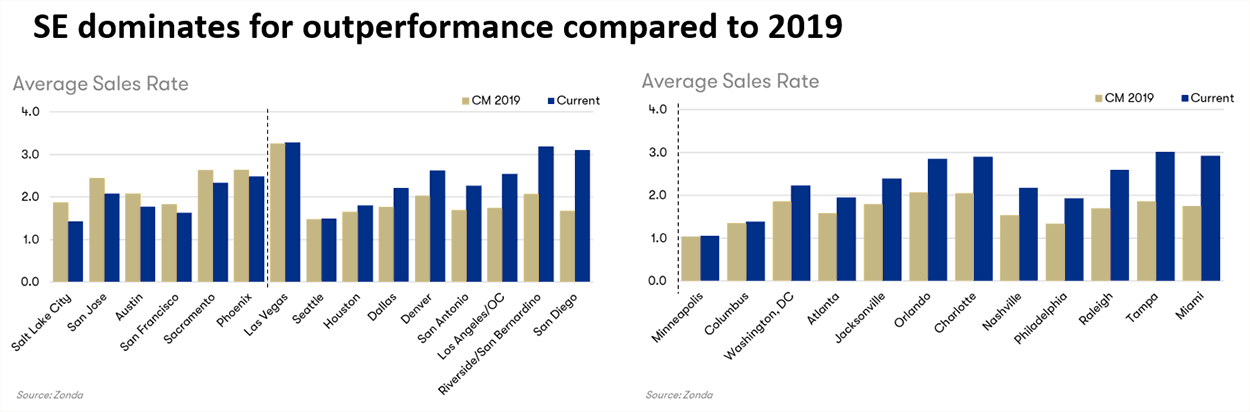
The Average Sales Rate is higher than in 2019 in most markets, with the biggest increases in the southeast. In the east more broadly, every market is outperforming 2019. In the west, it’s a more mixed bag, with some markets doing better than in 2019, some not.
In Miami, over 70% of home searches are from outside the market. That’s contributing to the higher sales rate, the higher level of home appreciation, and — because it’s largely not locals who are buying there — the higher payment-to-income ratio.
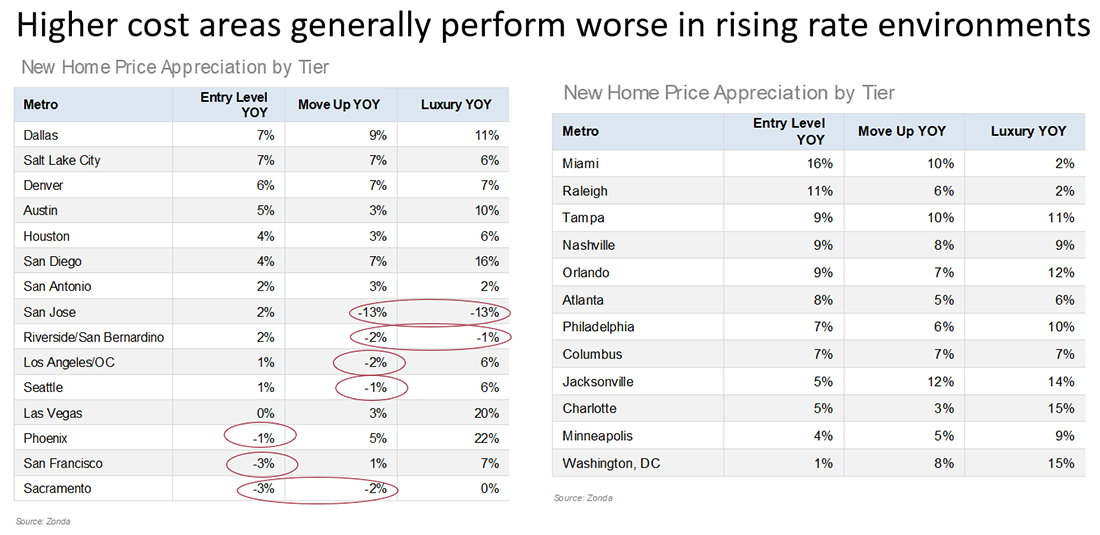
NEW HOME PRICE APPRECIATION
With respect to new home price appreciation, higher cost areas generally perform worse when interest rates are rising. A lot of California markets fall into this category. The most extreme example is San Jose, where both mid-tier and luxury homes are down -13% YOY.
The southeast (Miami, Raleigh, Tampa) is experiencing more price appreciation than other regions, and no market in the east has a negative change in new home prices.
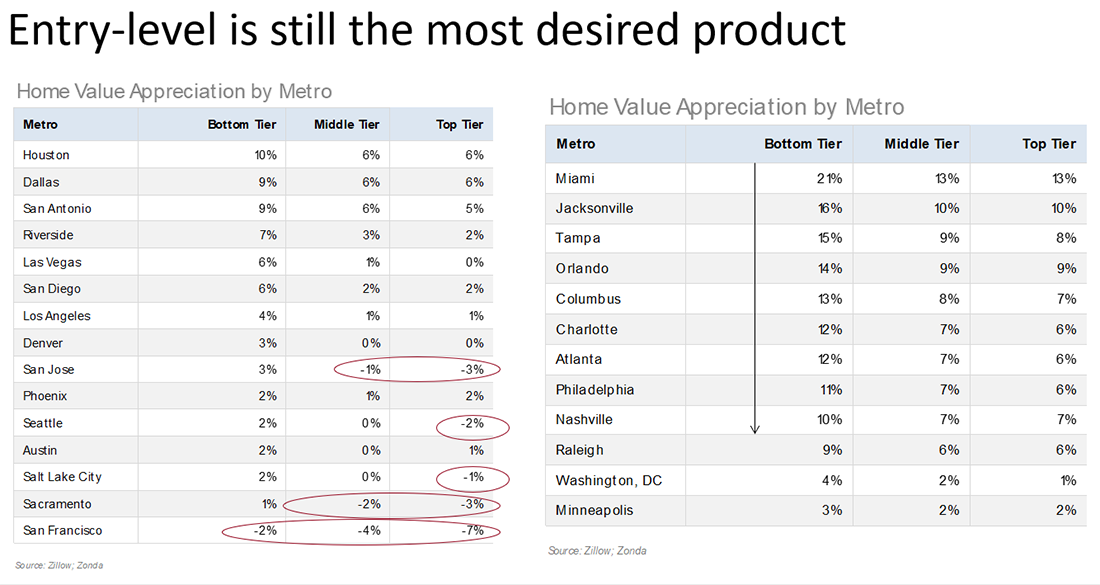
EXISTING HOME VALUE APPRECIATION
Across the country, entry-level homes are still the most desired product. Again, the southeast is the region with the greatest YOY increases in home value appreciation in this tier. The home value appreciation of entry-level homes is 21% in Miami, 16% in Jacksonville, 15% in Tampa, and 14% in Orlando.
At the other end of the spectrum, San Francisco is the only market that's had a drop in bottom tier price appreciation of -2%.
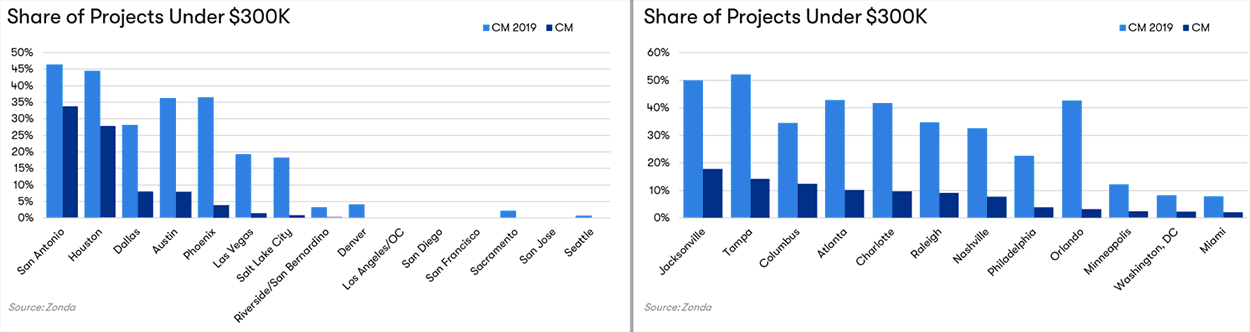
However, the share of projects that sell for under $300K is becoming increasingly rare. Today, in the west, other than in Texas, they’re practically non-existent. In the east, the share of projects under $300K has also dropped significantly in every market since 2019.
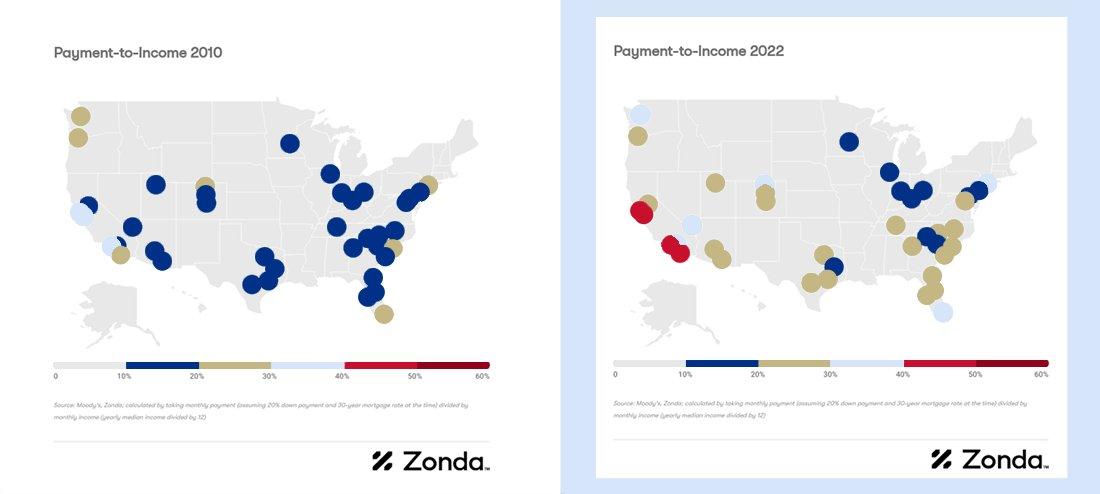
In the western half of the country, there are no markets that have payment-to-income ratios in the 10% to 20% range (although there used to be in 2010). There are still a few in the east (although not as many as in 2010).
Miami, however, is a relative hotspot in the east. Payment-to-income there is in the 30% to 40% range.
DEMAND
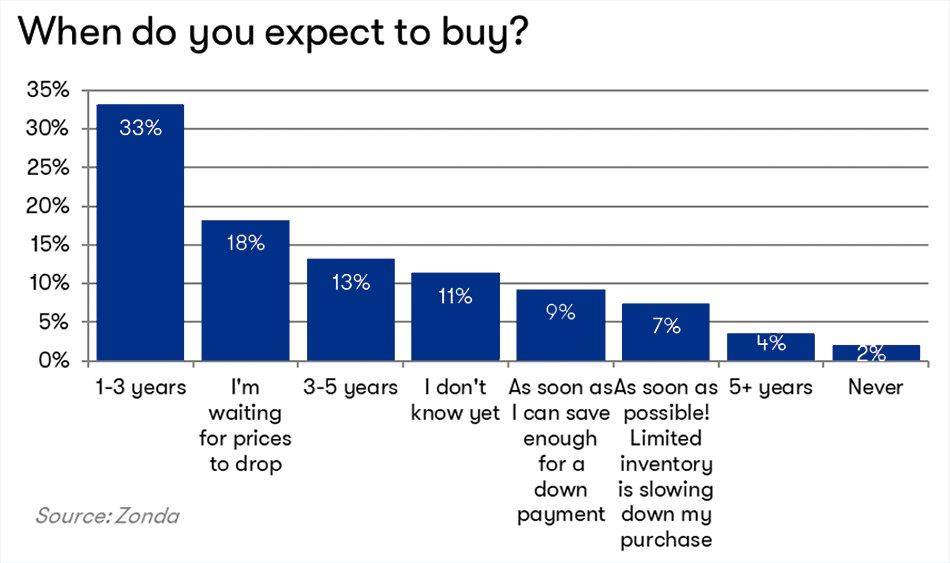
To return to the national picture, there are a lot of prospective buyers out there. Only 2% of consumers in Zonda’s survey don't ever expect to buy a home. They're just waiting for the right time. A massive 33% anticipate buying within 1-3 years. Wolf says Zonda’s economists are “extremely enthusiastic” about the near future of the housing market, and they’re “positive about the demand once…incomes and home prices are better aligned, and people feel more confident about the market.”
Builders FirstSource is here to help guide you through the ever-changing housing market. You can always contact your local experts for consultation, and stay tuned for more webinars coming soon.